
MACHINE LEARNING:proves immensely helpful in many industries in automating tasks that earlier required human labor one such application of ML is predicting whether a particular trade will be profitable or not.
In this article, we will learn how to predict a signal that indicates whether buying a particular stock will be helpful or not by using ML.
Let’s start by importing some libraries which will be used for various purposes which will be explained later in this article.
Python libraries make it very easy for us to handle the data and perform typical and complex tasks with a single line of code.
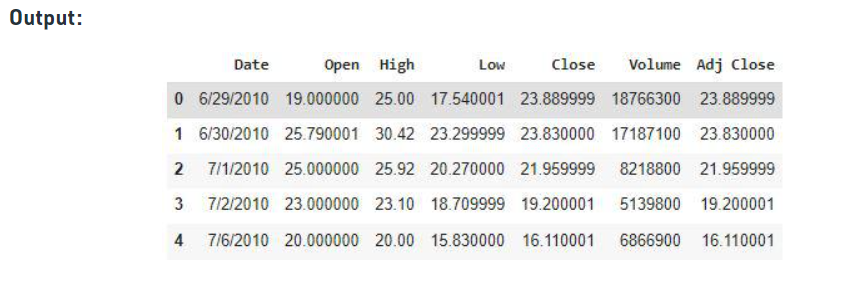
The dataset we will use here to perform the analysis and build a predictive model is Tesla Stock Price data. We will use OHLC(‘Open’, ‘High’, ‘Low’, ‘Close’) data from 1st January 2010 to 31st December 2017 which is for 8 years for the Tesla stocks.
df = pd.read_csv('/content/Tesla.csv')
df.head()
is an approach to analyzing the data using visual techniques. It is used to discover trends, and patterns, or to check assumptions with the help of statistical summaries and graphical representations.
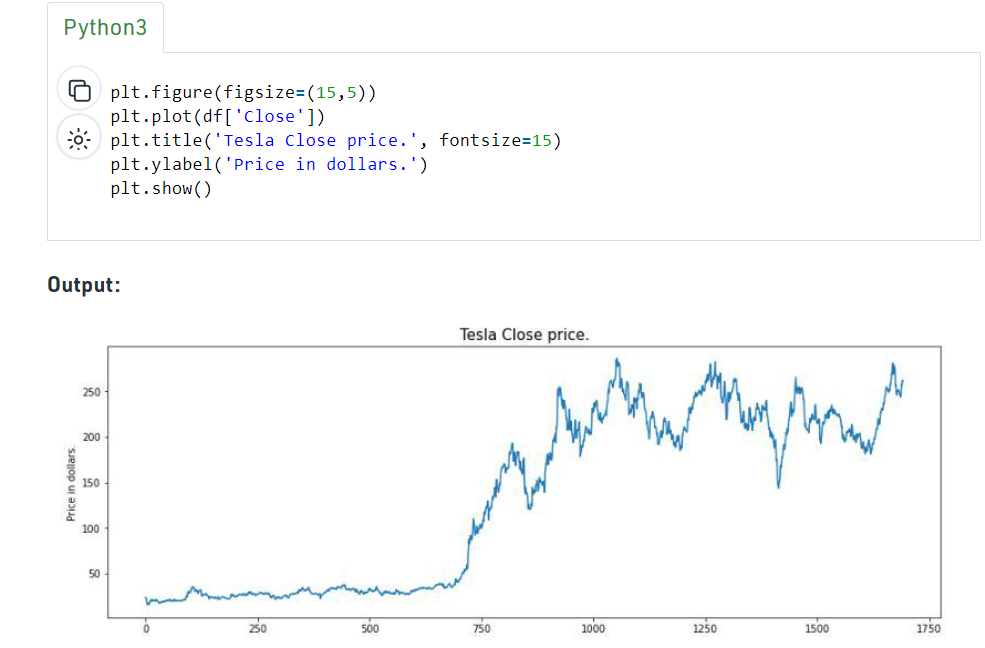
While performing the EDA of the Tesla Stock Price data we will analyze how prices of the stock have moved over the period of time and how the end of the quarters affects the prices of the stock.
Note: Find the best solution for electronics components and technical projects ideas
keep in touch with our social media links as mentioned below
Mifratech websites : https://www.mifratech.com/public/
Mifratech facebook : https://www.facebook.com/mifratech.lab
mifratech instagram : https://www.instagram.com/mifratech/
mifratech twitter account : https://twitter.com/mifratech
Contact for more information : mifratech@gmail.com / 080-73744810 / 9972364704